BitQuery

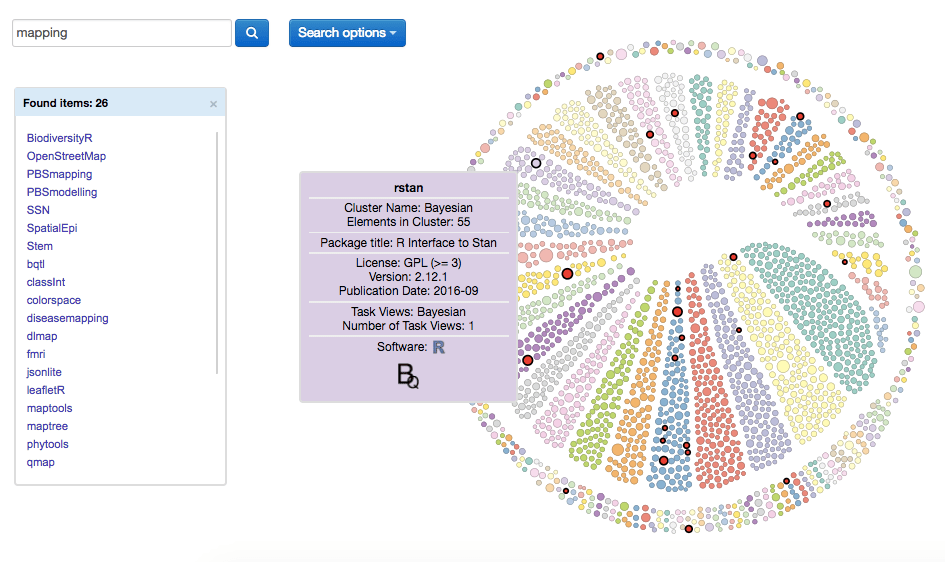
BitQuery is a GitHub1 API driven and D32 based search engine for open source repositories (OSR).

BitQuery pursues two main objectives:

  • (I) Provide an automatic OSR categorization system for data science teams and software developers promoting discoverability, technology transfer and coexistence
  • (II) Establish visual data exploration and topic driven navigation of GitHub users and organizations for collaborative reproducible research (CRR) and web deployment

The BitQuery architecture consists of three abstraction layers, following the visual analytics approach3:

  • GitHub API based parser layer (Data Management)
  • Smart Data layer (Analysis)
  • D3-3D Visu layer (Visualization)

1. GitHub is the world's largest code hosting platform for version control and collaboration.

2. D3.js is a JavaScript library for producing dynamic, interactive data visualizations in web browsers.

3. Visual analytics: Definition, process, and challenges. Lecture notes in computer science, 4950:154–176 (D. Keim et al., 2008)


GitHub Edition

BitQuery GitHub Edition is designed to explore and query GitHub organizations.

With the growing popularity of GitHub, the largest host of source code and collaboration platform in the world, it has evolved to a Big Data resource offering a variety of open source repositories. Since 2010 GitHub offers organizations, simplifying management of group-owned repositories, and thus facilitating the GitHub workflow for business and large open source projects. At present, there are more than one million organizations on GitHub, among them Google, Amazon Web Services, Microsoft Azure, Google Cloud Platform, Facebook, Twitter, Yahoo, RStudio, D3, Plotly and many more.

Two plots showing the growth of the GitHub organizations over time are presented below. They were produced with the help of the rgithubS package, see also the References.

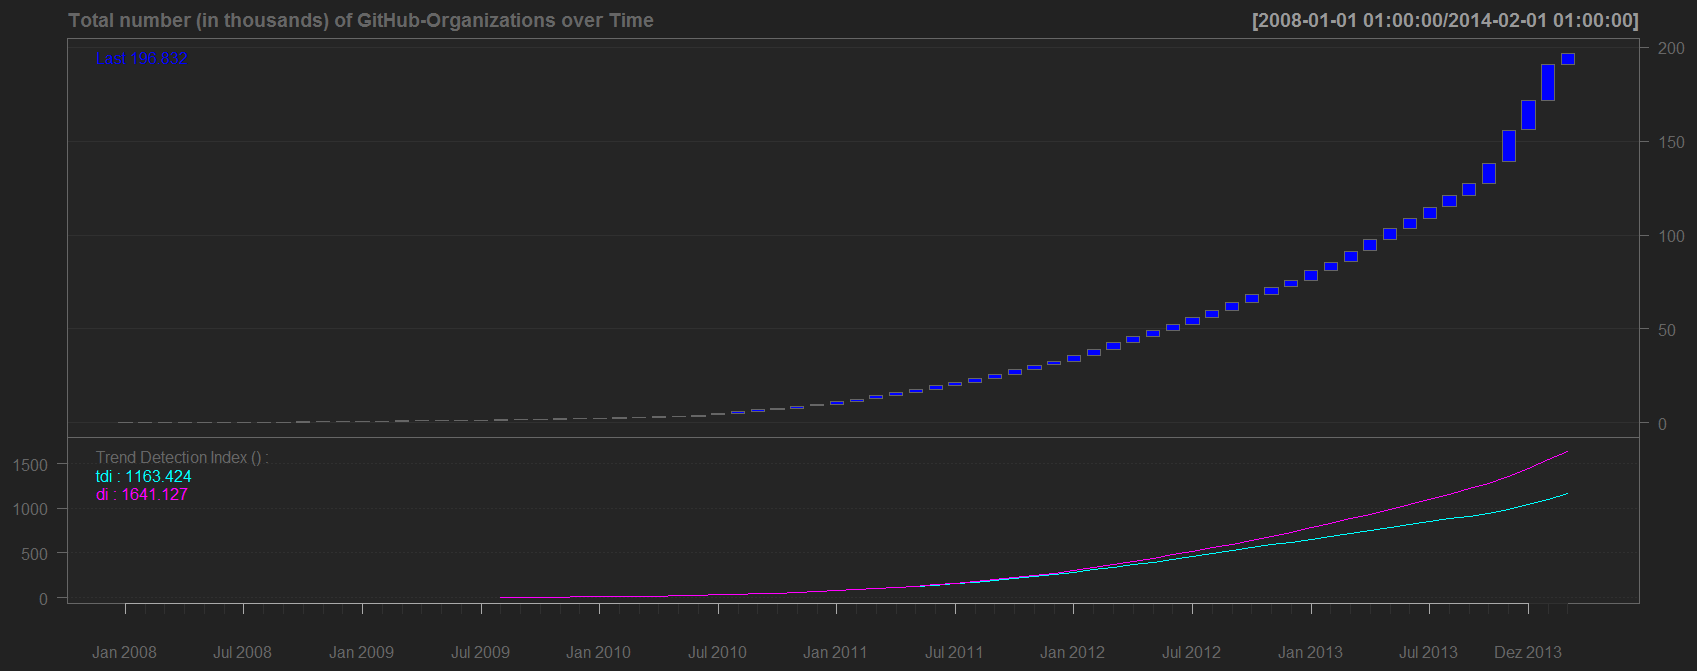
Total number (in thousands) of GitHub Organizations over time, monthly development, 2008-2013.

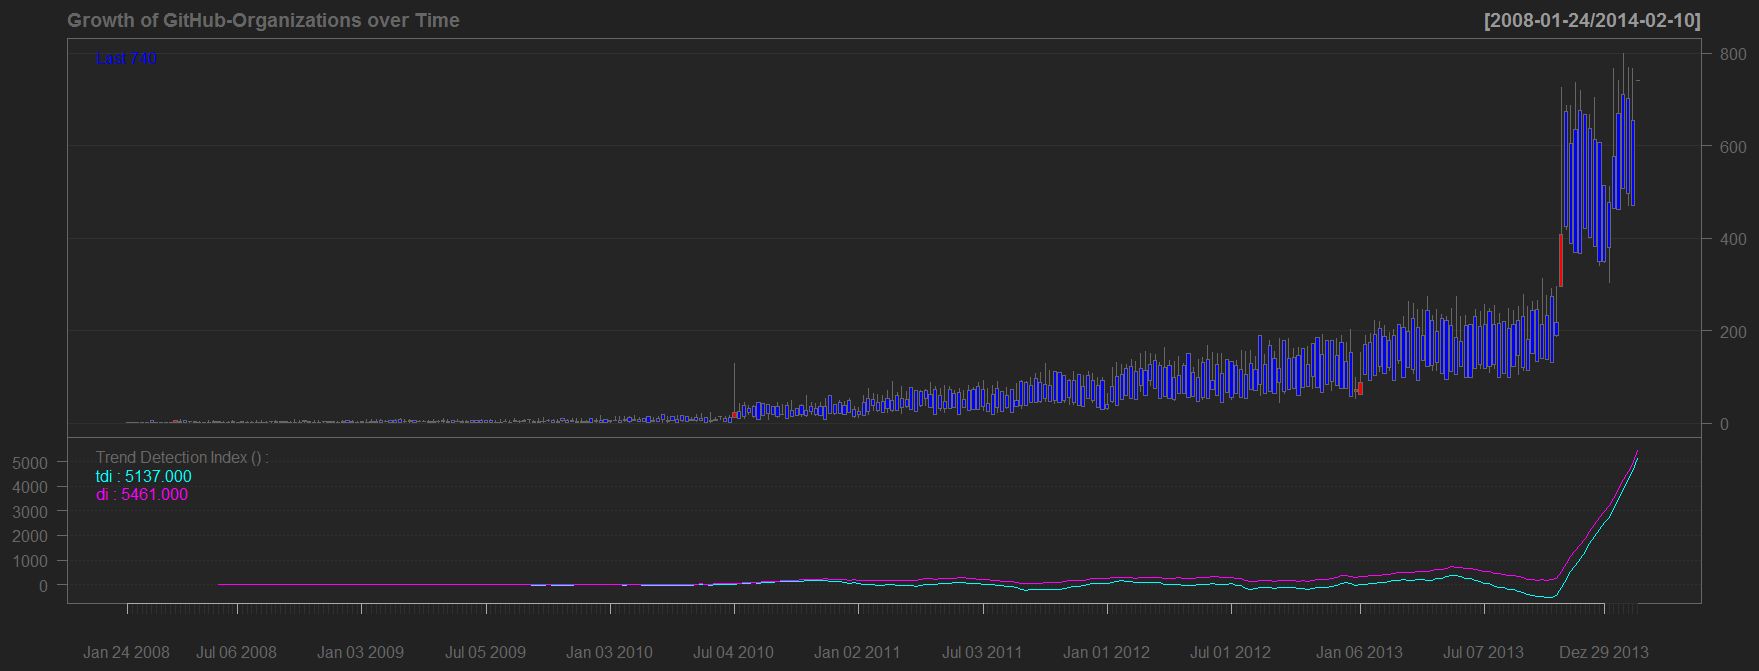
Growth of GitHub Organizations over time, weekly increments, 2008-2013.

BitTrinity

BitTrinity is the driving technology of BitQuery that allows to retrieve the GitHub data, postprocess and export them to the appropriate visualization schemes. It comprises the following main components:

  • GitHub API based parser layer: extracts data from GitHub
  • Smart Data layer: transforms Big Data into value, processing the data semantics and metadata via dynamic calibration of metadata configurations, text mining (TM) models and clustering methods
  • D3-3D Visu layer, or BitQuery Visual Analytics application (VA-App), which is powered by two JavaScript libraries for producing dynamic data visualizations in web browsers: D3.js and Three.js.

The API Parser Layer and Smart Data Layer have been programmed in R using various CRAN packages, see also the References. The design and implementation of the D3-3D Visu layer is described in detail in the VA-App section.

BitQuery VA-App

BitQuery VA-App creates an interactive network visualization that allows to overview, sort, zoom, filter and query the data. Additional components such as Legends, Tooltip and Search field provide detailed information on chosen subsets or single data nodes.

BitQuery VA-App was designed in full compliance with the visual analytics mantra:

"Analyze first - show the important - zoom, filter and analyze further - details on demand."

The VA-App has been programmed via JavaScript and CoffeeScript by means of D3.js, Three.js and some npm packages. The (simplified) component diagram of the software infrastructure is given below. For more information, see   d3VA - D3 for Visual Analytics: source code, libraries, components


BitQuery VA-App infrastructure, implemented via CoffeeScript classes


Main VA-App components


Tooltip

Details on demand
Shows detailed information on the chosen data node, e.g. package title, version etc.

TooltipSearch

Zoom and filter
Various Search parameters, e.g. package or author name.

Legend

Zoom and filter
Interactive Legends which enable to filter and project data subsets according to various dimensions and parameters.

Orbits

Overview
flexible layout settings for the radial graph scheme (by orbits).

GraphLayout

Overview
highly customizable graph layout which visualizes selected data.

NodesFilter

Zoom and filter
Creates and organizes the legends and performs interactions between them and the graph layout.

VisTransform

Overview
Prepares and filters data for the visualization and manages transformation settings (the animation will start when you move the mouse over the image).

BitQueryForced

Overview
Creates an interactive network visualization that allows to overview, sort, zoom, filter and query the data (the animation will start when you move the mouse over the image).

References


Publications and working papers


R Packages

  • github: Provides access to the Github v3 API. R package version 0.9.8. C. Scheidegger (2016)
  • rgithubS: Provides access to the GitHub v3 API. Special edition: search, statistics, parsers. R package version 0.9.9. C. Scheidegger and L. Borke (2017)
  • tm: A framework for text mining applications within R. R package version 0.7-5. I. Feinerer and K. Hornik (2018)
  • TManalyzer: Provides IR tools in 3 text mining models: BVSM, GVSM(TT) and LSA. It is complemented by metadata analytics and document clustering functionality. R package version 0.6.0. L. Borke (2017)


Our GitHub organizations


bemined

CRAN & GitHub Mining infrastructure


b2net

Collaboration Network


d3VA

D3 for Visual Analytics

Our Team


lborke

Lukas Borke

Software engineer and data scientist

polarstern

Svetlana Bykovskaya

Data visualization specialist and data scientist